
故障排查-内存-内存泄漏
前言
这里是模拟 JVM故障排查-内存部分的模拟流程,场景:内存泄漏。
环境准备:Java JDK 21、Spring Boot 项目、Linux(4 核心 4 GB) + Docker
模拟故障代码
<properties>
    <java.version>21</java.version>
    <maven.compiler.source>21</maven.compiler.source>
    <maven.compiler.target>21</maven.compiler.target>
    <maven-compiler-plugin.version>3.14.1</maven-compiler-plugin.version>
</properties>

<dependencies>
    <!-- Spring Boot -->
    <dependency>
        <groupId>org.springframework.boot</groupId>
        <artifactId>spring-boot-starter-web</artifactId>
    </dependency>
    <dependency>
        <groupId>org.springframework.boot</groupId>
        <artifactId>spring-boot-devtools</artifactId>
        <scope>runtime</scope>
        <optional>true</optional>
    </dependency>

    <!-- 工具:lombok 插件 -->
    <dependency>
        <groupId>org.projectlombok</groupId>
        <artifactId>lombok</artifactId>
        <optional>true</optional>
    </dependency>

    <!-- 测试 -->
    <dependency>
        <groupId>org.springframework.boot</groupId>
        <artifactId>spring-boot-starter-test</artifactId>
        <scope>test</scope>
    </dependency>
</dependencies>

<build>
    <plugins>
        <plugin>
            <groupId>org.springframework.boot</groupId>
            <artifactId>spring-boot-maven-plugin</artifactId>
            <configuration>
                <excludes>
                    <exclude>
                        <groupId>org.projectlombok</groupId>
                        <artifactId>lombok</artifactId>
                    </exclude>
                </excludes>
            </configuration>
        </plugin>
        <plugin>
            <groupId>org.apache.maven.plugins</groupId>
            <artifactId>maven-compiler-plugin</artifactId>
            <version>${maven-compiler-plugin.version}</version>
            <configuration>
                <source>${maven.compiler.source}</source>
                <target>${maven.compiler.target}</target>
                <encoding>${project.build.sourceEncoding}</encoding>
            </configuration>
        </plugin>
    </plugins>
</build>import org.springframework.scheduling.annotation.EnableScheduling;
import org.springframework.scheduling.annotation.Scheduled;
import org.springframework.stereotype.Service;
import java.util.ArrayList;
import java.util.List;
import java.util.concurrent.ConcurrentHashMap;
@Service
@EnableScheduling
public class MemoryLeakService {
// 【泄漏源头】:静态变量,生命周期与 JVM 相同,GC 无法回收
private static final ConcurrentHashMap<String, List<byte[]>> LEAK_CACHE = new ConcurrentHashMap<>();
private int counter = 0;
// 每 2 秒往静态 Map 中塞入 1MB 的数据,且永远不删除
@Scheduled(fixedRate = 2000)
public void leakMemory() {
String key = "user_session_" + (counter++);
List<byte[]> bigData = new ArrayList<>();
// 每次分配 1MB 的 byte 数组
bigData.add(new byte[1024 * 1024]);
LEAK_CACHE.put(key, bigData);
if (counter % 10 == 0) {
System.out.println("【泄漏提示】当前缓存大小: " + LEAK_CACHE.size() + " MB");
}
}
}import org.springframework.web.bind.annotation.GetMapping;
import org.springframework.web.bind.annotation.RestController;
import javax.management.MBeanServer;
import javax.management.ObjectName;
import java.lang.management.ManagementFactory;
@RestController
public class JvmDiagnosticController {
// 手动触发 Full GC (用于观察 GC 后内存是否下降)
@GetMapping("/gc")
public String triggerGC() {
System.gc();
return "GC triggered!";
}
// 手动触发 Heap Dump (导出内存快照)
@GetMapping("/dump")
public String triggerDump() throws Exception {
MBeanServer server = ManagementFactory.getPlatformMBeanServer();
ObjectName objectName = new ObjectName("com.sun.management:type=HotSpotDiagnostic");
String fileName = "/tmp/heapdump_" + System.currentTimeMillis() + ".hprof";
// 参数: 文件路径, 是否只 dump 存活对象 (true 代表 dump 前自动执行一次 GC)
server.invoke(objectName, "dumpHeap", new Object[]{fileName, true}, new String[]{"java.lang.String", "boolean"});
return "Heap dump saved to: " + fileName;
}
}# 使用 Eclipse Temurin JDK 21
FROM eclipse-temurin:21-jdk
# 设置工作目录
WORKDIR /app
# 复制打包好的 jar 包
COPY target/*.jar app.jar
# 【核心】配置 JVM 诊断参数 (复用第一章 JDK 11+ 终极模板)
# 指定 GC,限制堆内存为 512 MB,让泄漏快速暴露;开启 OOM 自动 Dump 和 GC 日志
ENV JAVA_OPTS="-Xms256m -Xmx512m \
-XX:+UseG1GC \
-XX:+HeapDumpOnOutOfMemoryError -XX:HeapDumpPath=/app/logs/heapdump_%p.hprof \
-Xlog:gc*,gc+age=trace,safepoint:file=/app/logs/gc_%p.log:time,uptime,level,tags:filecount=5,filesize=10M \
-XX:ErrorFile=/app/logs/hs_err_pid%p.log \
-XX:NativeMemoryTracking=summary"
# 创建日志目录
RUN mkdir -p /app/logs
# 暴露端口
EXPOSE 8080
# 启动应用
ENTRYPOINT ["sh", "-c", "exec java $JAVA_OPTS -jar app.jar"]打包
mvn clean package -DskipTestsdocker build -t test_memory_leak:1.0 .运行
docker run -d --name leak-app -p 34000:8080 -v $(pwd)/logs:/app/logs test_memory_leak:1.0进入容器查看 JVM 状态
docker exec -it leak-app /bin/bash在容器内执行 jcmd 查看堆内存概况
jcmd 1 GC.heap_info导出文件
访问 dump
然后在 Linux 中,退出容器,在宿主机执行 (注意替换实际的文件名)
docker cp leak-app:/tmp/heapdump_1779707209586.hprof ./dump1.hprofdocker cp leak-app:/tmp/heapdump_1779708214587.hprof ./dump2.hprof分析结果
使用 MAT 打开文件,分析结果,Problem Suspect 1 中的内容:
The class org.lycka.test_memory_leak.MemoryLeakService, loaded by org.springframework.boot.loader.launch.LaunchedClassLoader @ 0xeae8c4c8, occupies 506,556,120 (98.13%) bytes. The memory is accumulated in one instance of java.util.concurrent.ConcurrentHashMap$Node[], loaded by <system class loader>, which occupies 506,555,192 (98.13%) bytes.

Thread org.apache.tomcat.util.threads.TaskThread @ 0xeb510ca8 Catalina-utility-1 has a local variable or reference to org.springframework.boot.loader.launch.LaunchedClassLoader @ 0xeae8c4c8 which is on the shortest path to java.util.concurrent.ConcurrentHashMap$Node[1024] @ 0xfcd94f88. The thread org.apache.tomcat.util.threads.TaskThread @ 0xeb510ca8 Catalina-utility-1 keeps local variables with total size 440 (0.00%) bytes.

The stacktrace of this Thread is available. See stacktrace. See stacktrace with involved local variables.

Keywords

org.lycka.test_memory_leak.MemoryLeakService
org.springframework.boot.loader.launch.LaunchedClassLoader
java.util.concurrent.ConcurrentHashMap$Node[]
结论:整个堆内存大约 512MB,其中 98.13%(约 506MB) 都被 MemoryLeakService 这个类占用了。具体来说,是它内部的那个 ConcurrentHashMap(底层是 Node[] 数组)吃掉了几乎所有的内存。
线索:Spring Boot 的定时任务线程(Catalina-utility-1)通过类加载器(LaunchedClassLoader)加载了 MemoryLeakService,从而间接关联到了这个巨大的 Map。
找证据的步骤:
- 上述信息说明,问题出在
MemoryLeakService - 在 MAT 中,在
Inspector/ 饼图中右键点击,选择:Path To GC Roots→exclude all phantom/weak/soft etc. references,目的是确保只有强引用,它不会被 GC 回收。 - 操作完 MAT 会展示一棵树,这是 GC ROOT,可以看到:
MemoryLeakService中的ArrayList持续累积对象,而该实例被 Tomcat 线程的contextClassLoader间接强引用,导致无法回收。
饼图: 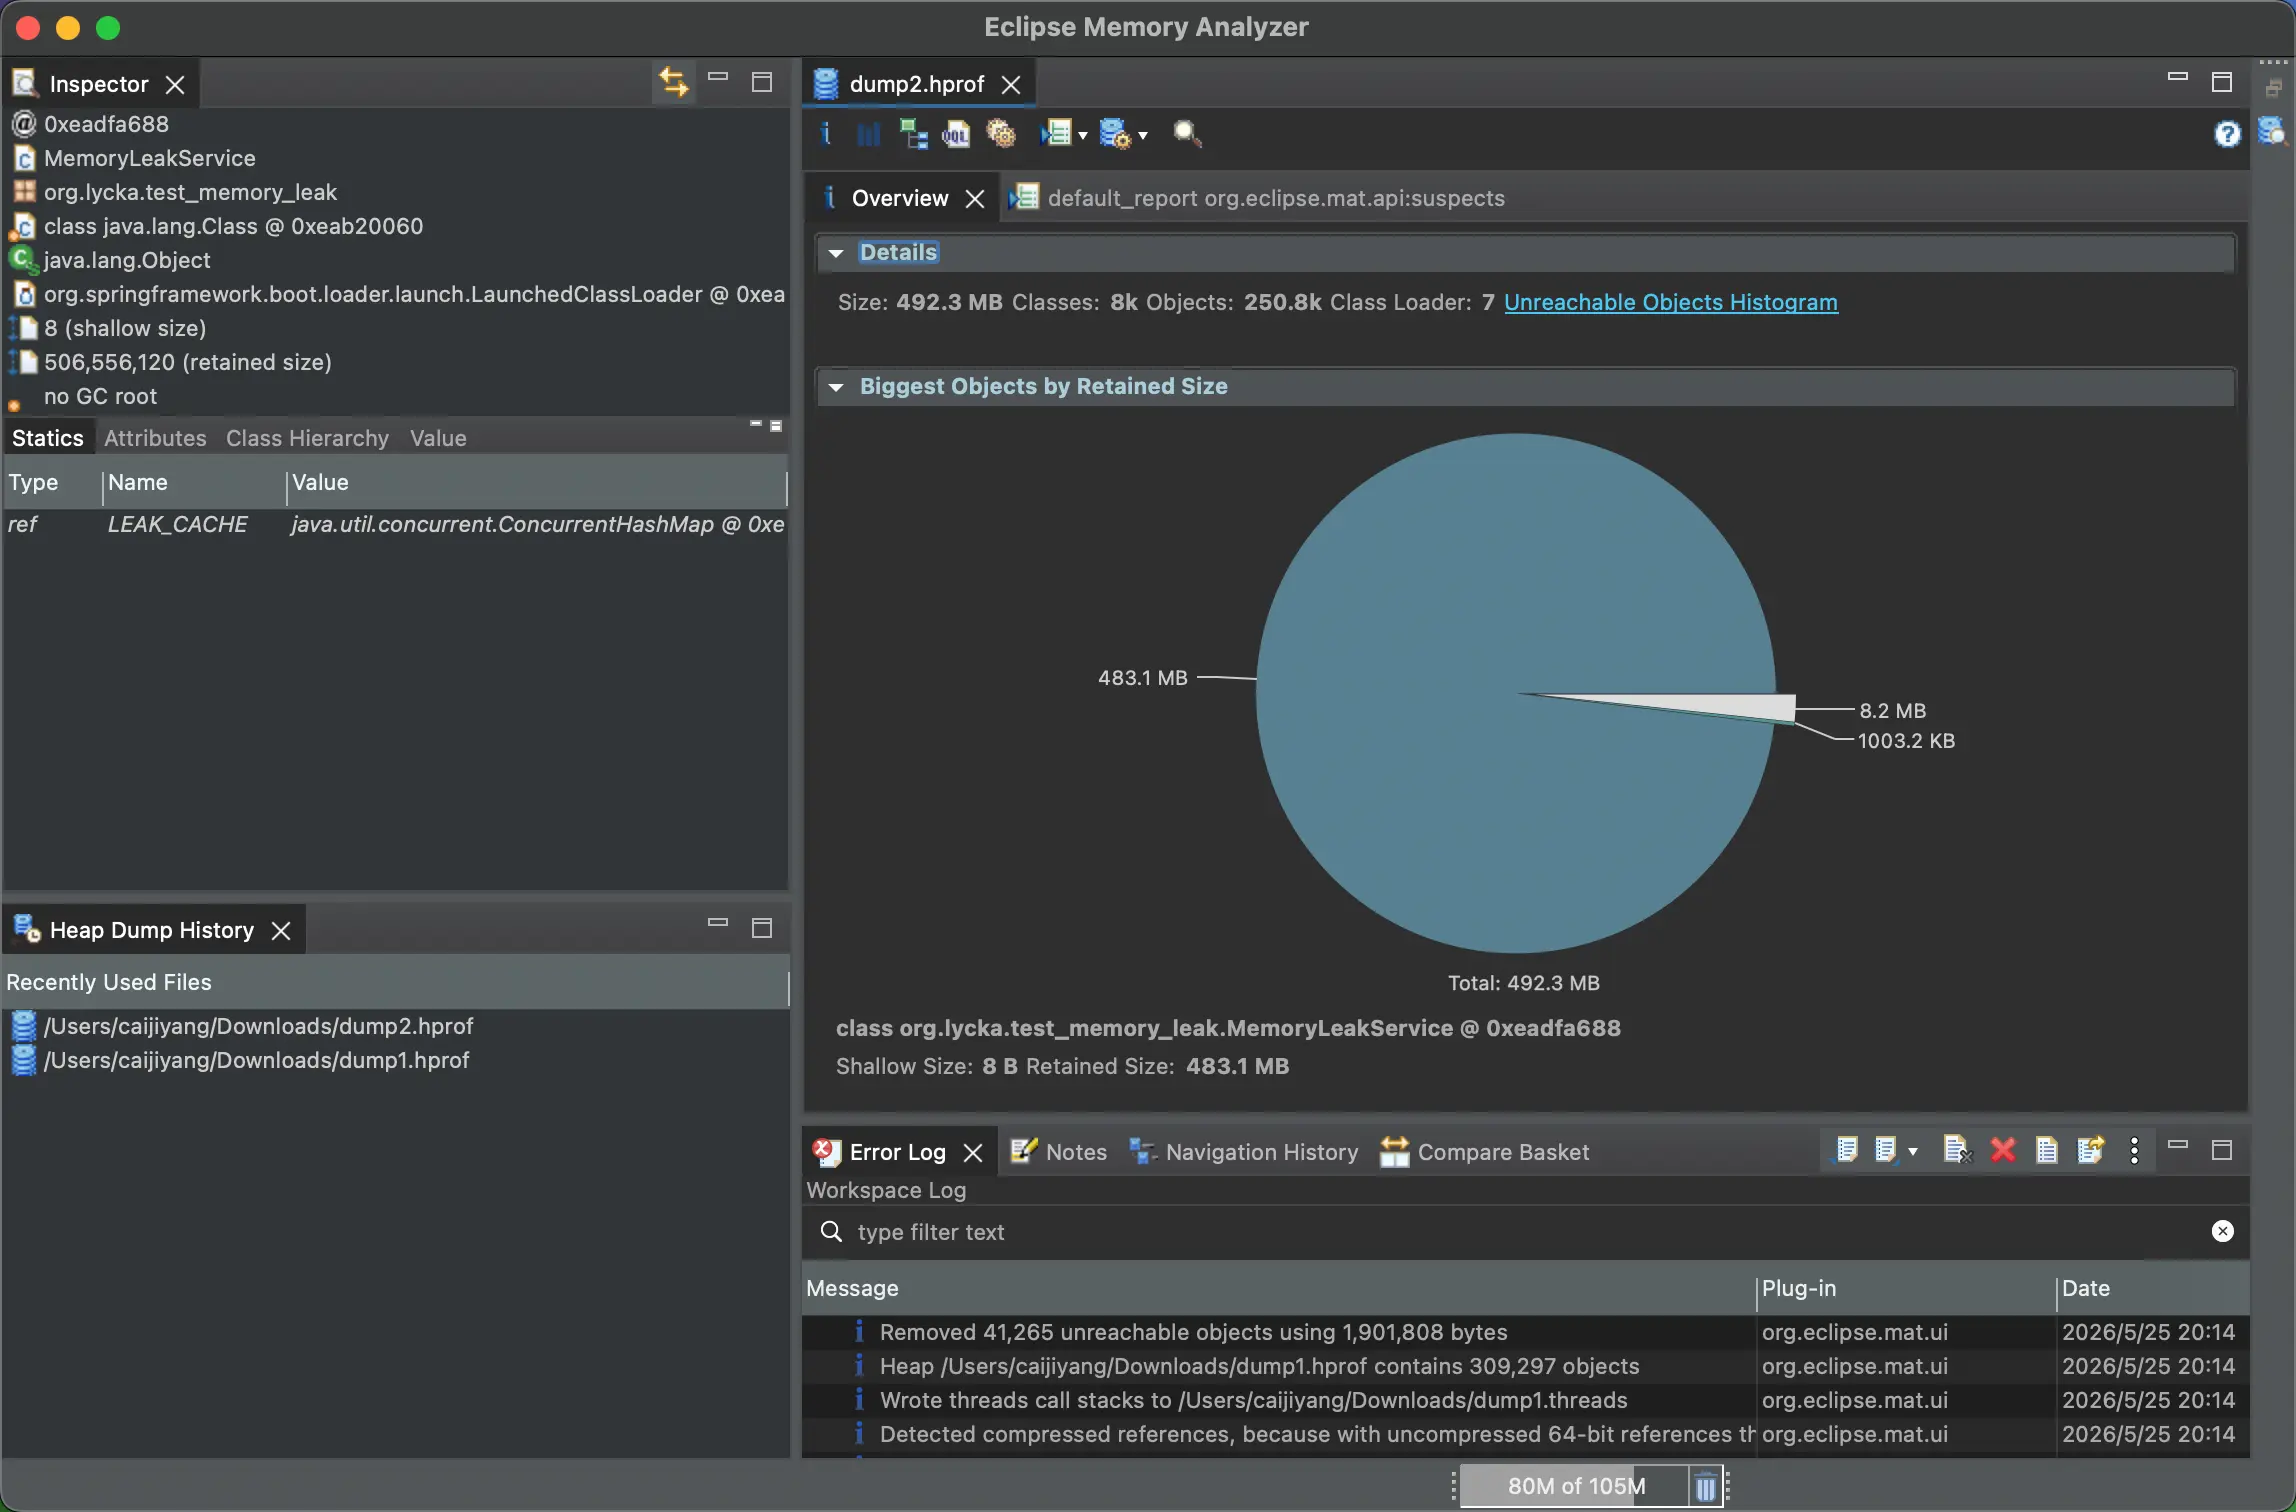
GC Root 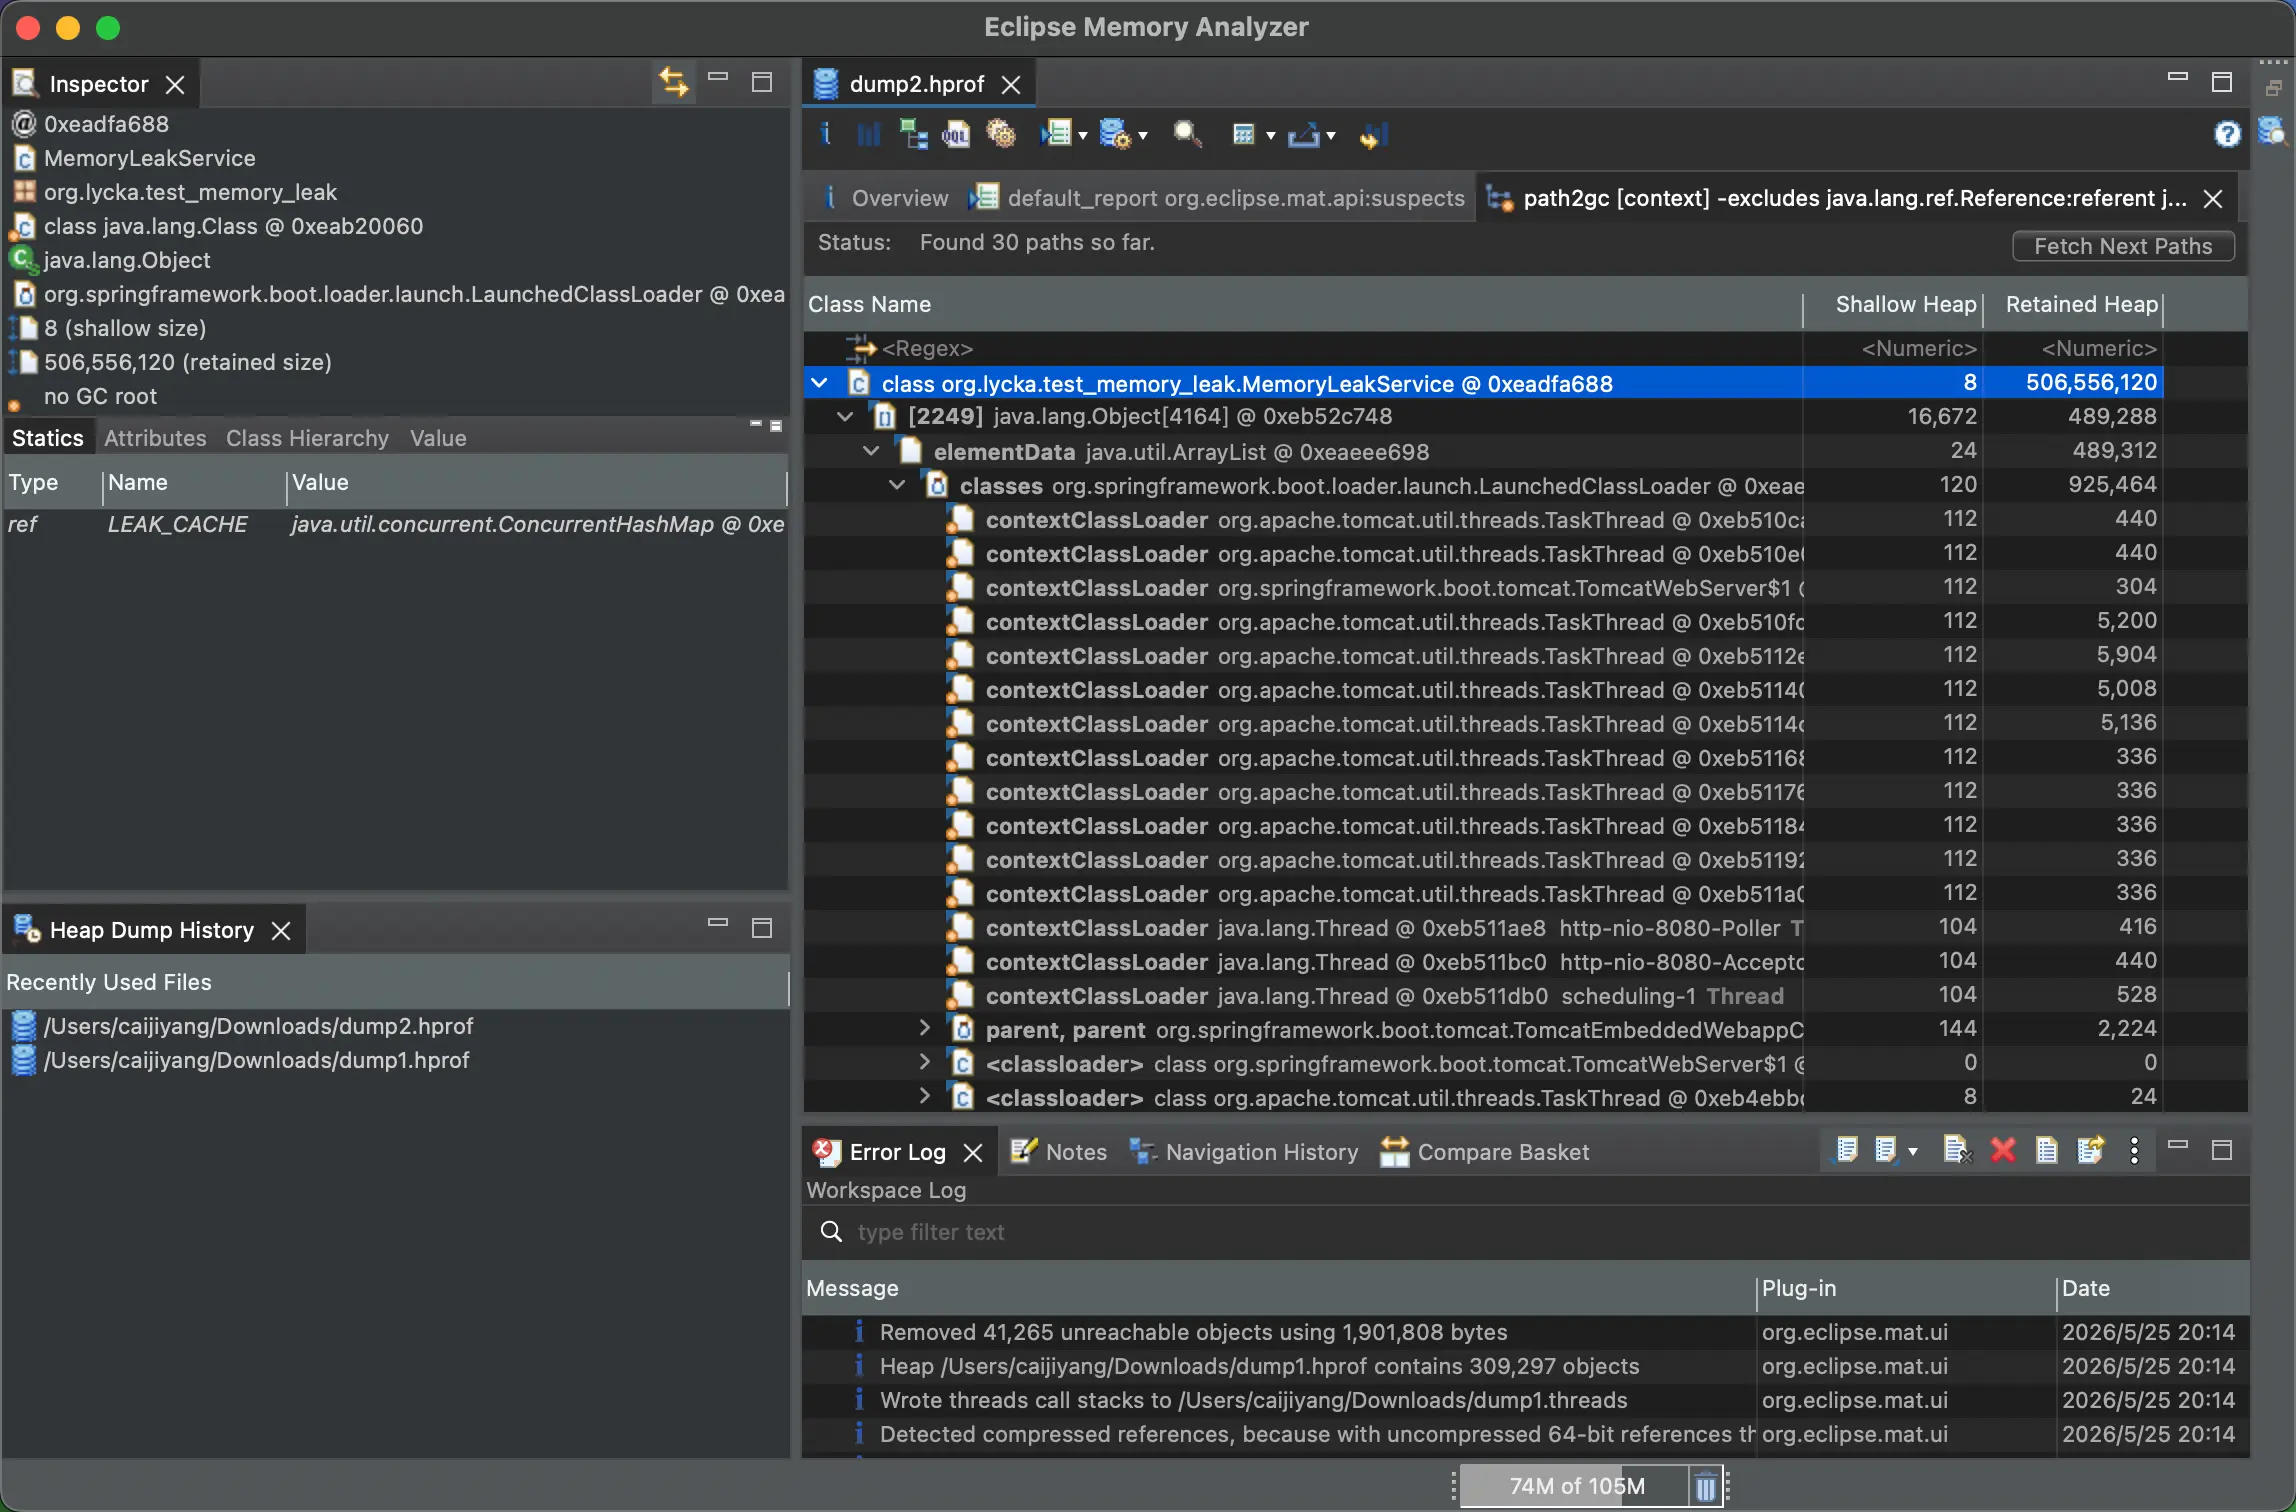
文件对比
- 先打开另外一个 dump 文件(顶部,File → Open File)
- 在 MAT 顶部工具栏,点击
Histogram(直方图)图标 - 点击表头
Retained Heap,让它降序排列。 - 点击顶部图标
Compare with another Heap Dump,选择之前的一份 dump - 可以很清晰的看到,系统本身的类增长较少,增长异常的类就是内存泄漏的元凶了。
对比图 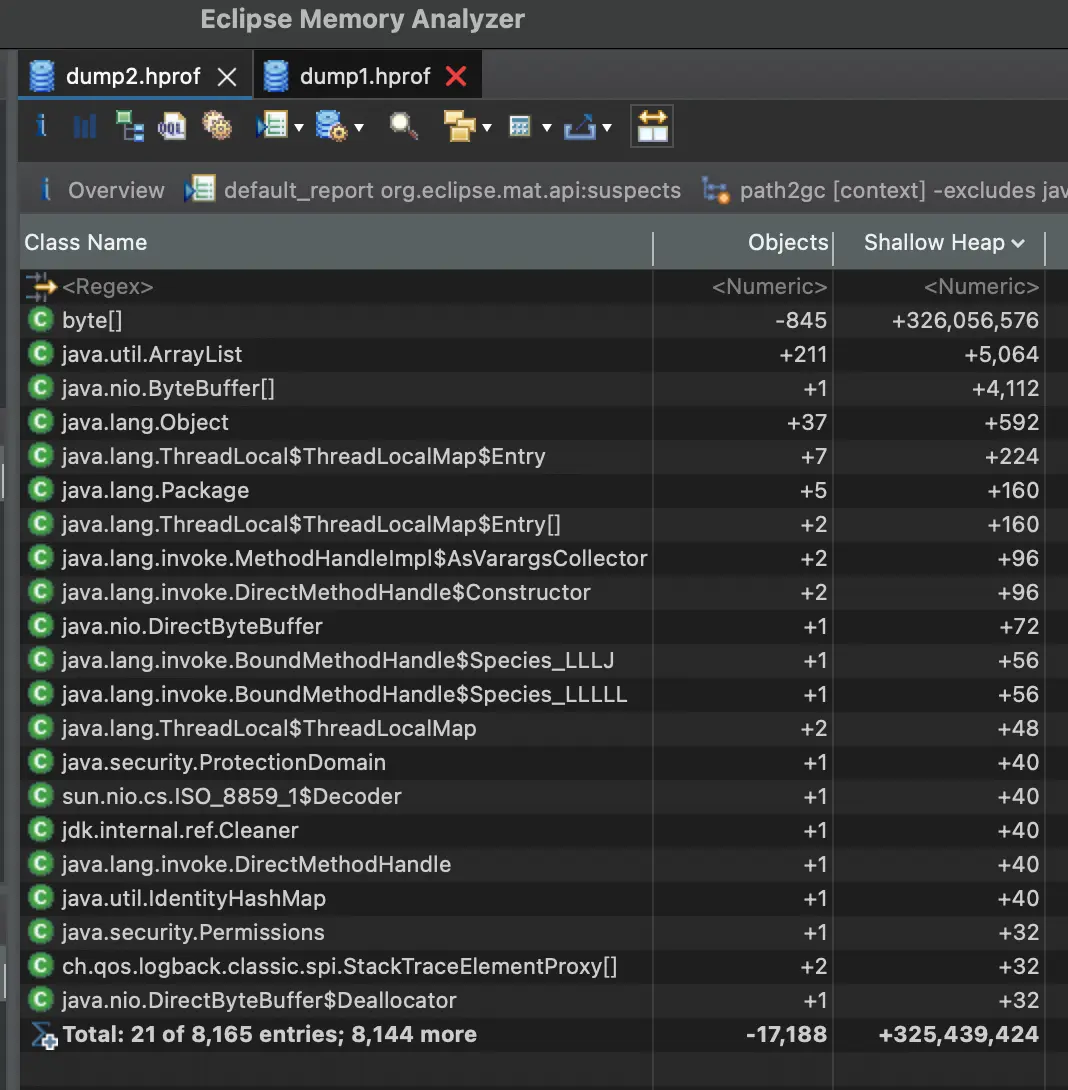
至此,一个简单的内存泄漏问题就被定位到了,接下来就是去看代码,修改发生内存泄漏的部分了。
版权所有
版权归属: